Get the latest crypto news, updates, and reports by subscribing to our free newsletter.
Giấy phép số 4978/GP-TTĐT do Sở Thông tin và Truyền thông Hà Nội cấp ngày 14 tháng 10 năm 2019 / Giấy phép SĐ, BS GP ICP số 2107/GP-TTĐT do Sở TTTT Hà Nội cấp ngày 13/7/2022.
© 2026 Index.vn
REAL Shows Network (RSN) is a national TV network for top real estate professionals and influential local leaders, giving select hosts in each market the exclusive opportunity to lead a full 30-minute show showcasing their expertise, partners, and community. Created by an Emmy-nominated, Telly Award-winning production team, RSN delivers cinematic,…

Bitcoin (BTC) posted a modest gain on April 3, trading at one point above $67,200 as daily funding rates surged by more than 300%. The move indicates that leveraged traders increased bullish exposure, with long-position holders paying higher fees to maintain bets that “digital gold” will rebound further.
Despite the funding jump, Bitcoin open interest has started to cool, standing at -0.12% at the time of writing based on data Finbold retrieved from CryptoQuant. This combination suggests the funding spike was not supported by a meaningful inflow of fresh capital. Instead, it more likely reflects a repositioning among existing traders rather than a broad wave of new bullish participants.
BTC derivatives overview. Source: CryptoQuant
Rapid funding rate spikes can reflect growing confidence, but they can also be interpreted as signs of an overheated market. If elevated rates begin to erode long-position profitability, the risk of a sudden correction can increase.
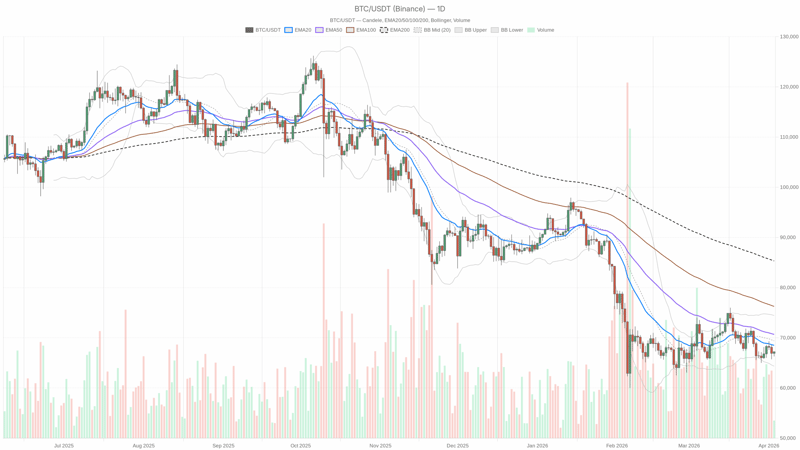
In the near term, BTC’s direction is being shaped by institutional demand dynamics and broader macroeconomic conditions. The immediate focus is whether BTC can hold support near $67,000. A sustained defense of that level could support a move toward $68,500, while a breakdown below $66,500 may intensify selling pressure.
Bitcoin ETFs have been a key factor in the outlook, but results over the past week have been less favorable. According to data provided by Lookonchain, ETFs recorded $375 million in weekly net outflows.
Because sustained net inflows typically create direct buying pressure and reinforce Bitcoin’s role in investor portfolios—especially during periods of geopolitical uncertainty—continued outflows could point to weakening institutional appetite and contribute to further downside.
Technical indicators also suggest a broader downtrend. The Relative Strength Index (RSI) is at 44, indicating mild weakness, and Bitcoin prices are below all major moving averages (MA).

In brief\n\nBitcoin dropped to about $93,000, falling back below the EMA50 and putting its recent golden cross at risk of invalidation. The global crypto market cap stands at $3.15 trillion, down 2.38% in 24 hours. On Myriad Markets, 82% of the money is betting on Bitcoin pumping to $100K before…