Get the latest crypto news, updates, and reports by subscribing to our free newsletter.
Giấy phép số 4978/GP-TTĐT do Sở Thông tin và Truyền thông Hà Nội cấp ngày 14 tháng 10 năm 2019 / Giấy phép SĐ, BS GP ICP số 2107/GP-TTĐT do Sở TTTT Hà Nội cấp ngày 13/7/2022.
© 2026 Index.vn
REAL Shows Network (RSN) is a national TV network for top real estate professionals and influential local leaders, giving select hosts in each market the exclusive opportunity to lead a full 30-minute show showcasing their expertise, partners, and community. Created by an Emmy-nominated, Telly Award-winning production team, RSN delivers cinematic,…

Coinglass’ ETH liquidation heatmap indicates that Ethereum’s futures market is concentrated between two liquidation “walls,” where nearly $1.8 billion in leveraged positions could be forced out depending on whether price moves below or above key levels.
According to Coinglass, if spot ETH drops below roughly $1,952, the cumulative long liquidation intensity on mainstream centralized exchanges would reach about $986 million. This zone is described as one where cascading sell orders could accelerate downside.
On the upside, a clean break above about $2,154 would shift pressure to shorts. Coinglass data suggests up to $810 million in cumulative short liquidations could be triggered on major venues.
Coinglass says its liquidation heatmap aggregates open leveraged long and short positions across leading futures exchanges and calculates the notional value that would be liquidated across different price bands. These bands appear as dense clusters, reflecting where leverage is most heavily concentrated.
The heatmap framing is that once price enters these clusters, margin calls and forced unwinds can compound volatility, regardless of whether the initial move is driven by spot activity or derivatives positioning.
The clustering of approximately $986 million in leveraged longs just under $1,952 and about $810 million in shorts above $2,154 implies that relatively small percentage moves—around 5% to 7% around current spot levels—could produce outsized forced flows.
In Coinglass-referenced commentary from exchange research notes, the risk is that when price moves into the liquidation zone, forced covering can quickly turn crowded bearish positioning into upward volatility; conversely, over-extended longs with thin margin can face accelerated downside if price moves against them.
For traders using leverage, the $1,952 to $2,154 corridor is presented as a high-stakes range: declines toward the lower boundary raise the risk of long liquidation cascades, while breakouts above the upper boundary could trigger short squeezes that extend beyond immediate fundamentals in the near term.
The overall takeaway from the heatmap is that position sizing and margin buffers should account for these visible liquidation shelves, rather than relying only on headline price targets.
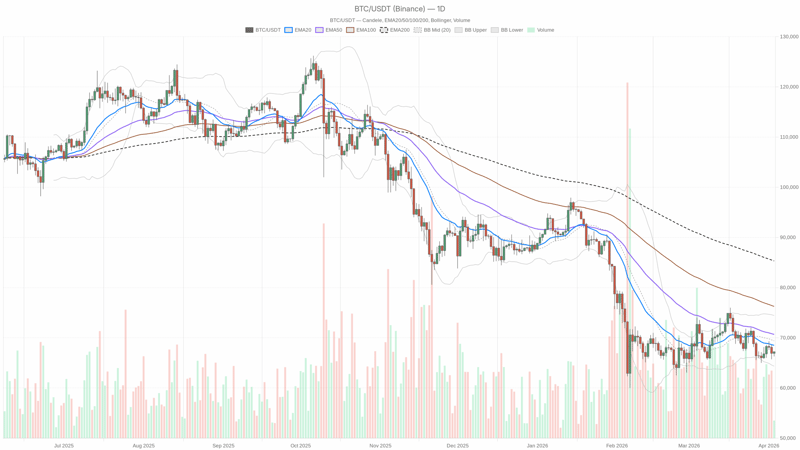
In brief\n\nBitcoin dropped to about $93,000, falling back below the EMA50 and putting its recent golden cross at risk of invalidation. The global crypto market cap stands at $3.15 trillion, down 2.38% in 24 hours. On Myriad Markets, 82% of the money is betting on Bitcoin pumping to $100K before…