Get the latest crypto news, updates, and reports by subscribing to our free newsletter.
Giấy phép số 4978/GP-TTĐT do Sở Thông tin và Truyền thông Hà Nội cấp ngày 14 tháng 10 năm 2019 / Giấy phép SĐ, BS GP ICP số 2107/GP-TTĐT do Sở TTTT Hà Nội cấp ngày 13/7/2022.
© 2026 Index.vn
REAL Shows Network (RSN) is a national TV network for top real estate professionals and influential local leaders, giving select hosts in each market the exclusive opportunity to lead a full 30-minute show showcasing their expertise, partners, and community. Created by an Emmy-nominated, Telly Award-winning production team, RSN delivers cinematic,…
Market participants are closely watching Ethereum price news as ETH trades in a mid-range during a phase of extreme fear and compressed volatility.
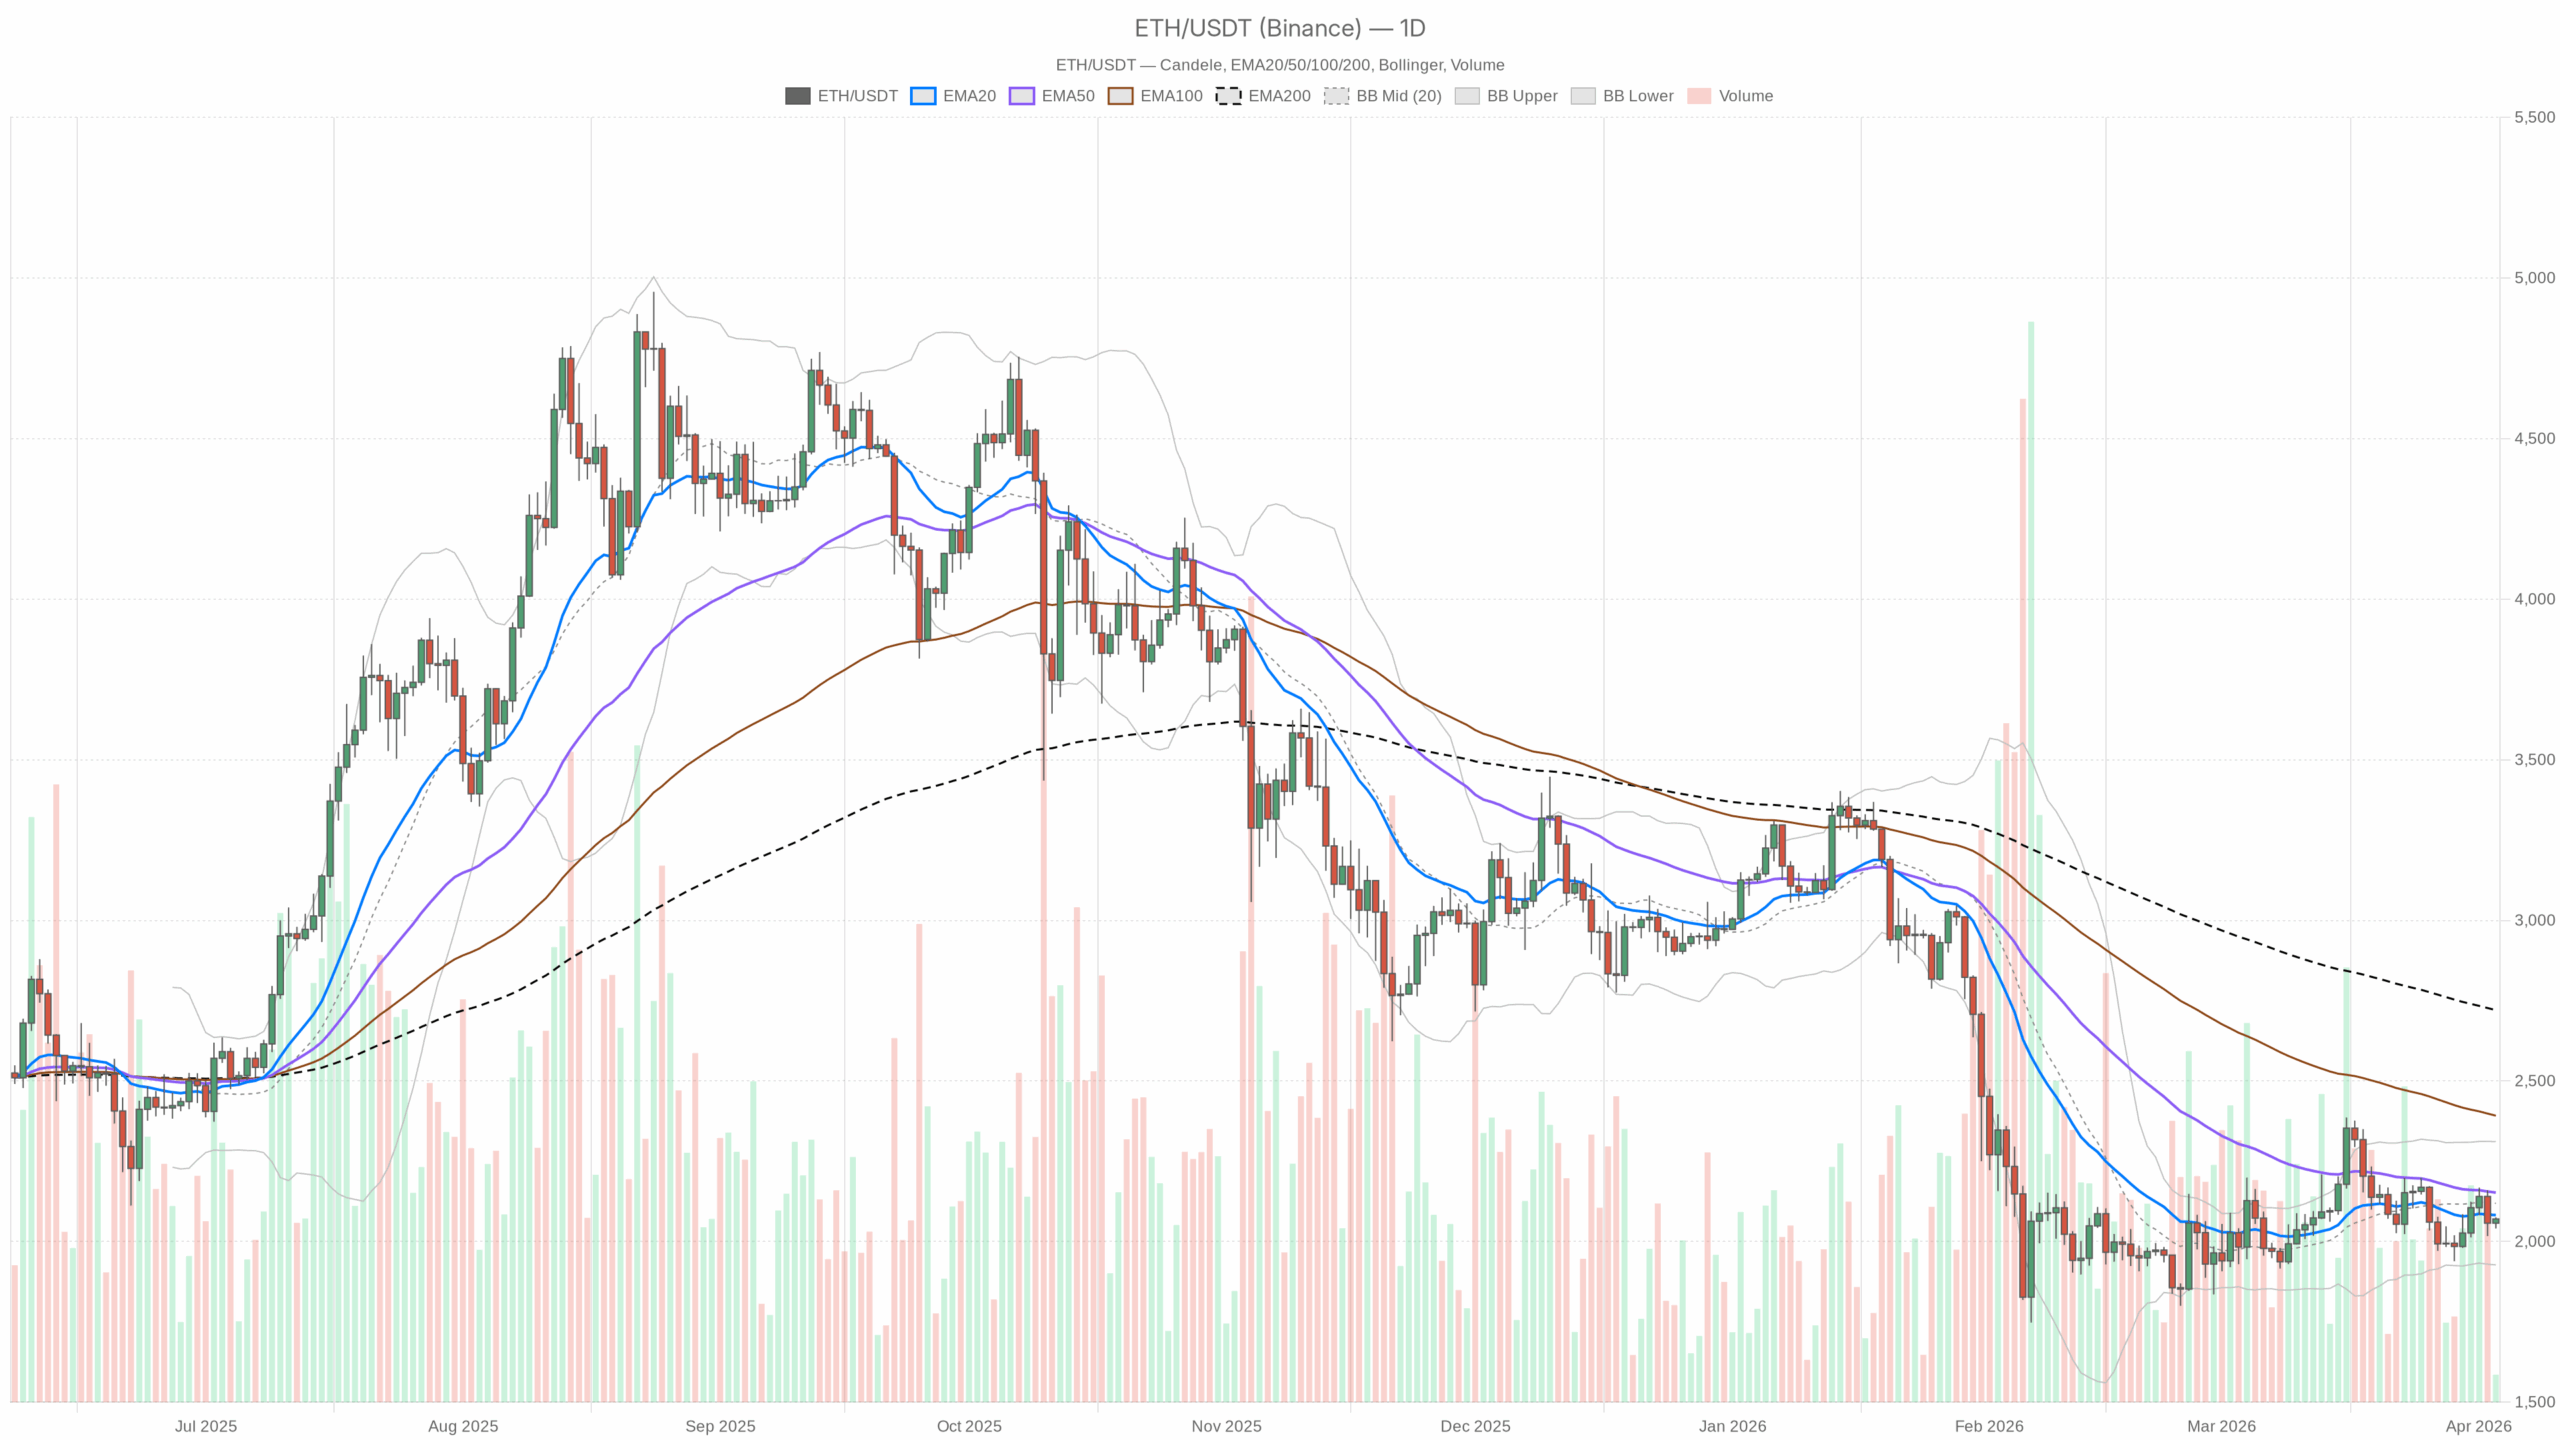
The daily timeframe sets the main scenario as bearish, though not in a freefall. Price is attempting to base within a broader downtrend.
ETH is trading below the 20-day, 50-day, and 200-day EMAs. The 20- and 50-day averages sit above spot, while the 200-day EMA is far overhead, reflecting a longer-term downtrend from the $2.7k area. The structure implies rallies into the $2.10k–$2.15k area are still likely to face selling pressure until ETH can reclaim those levels.
RSI is just under 50, indicating momentum is balanced between bullish and bearish forces. It is not oversold and not overbought, consistent with a controlled downtrend rather than panic selling.
Daily MACD remains below zero and below its signal, with a slightly negative histogram. This points to lingering bearish impulse, but the values are described as small—suggesting the sell wave may be aging rather than accelerating.
ETH is trading below the Bollinger mid-band but comfortably inside the bands, not hugging the lower edge. The band range of roughly $1,927–$2,311 frames likely swing extremes if conditions remain similar. With ATR near $98, daily volatility is moderate—around 4%–5% per day on average—supporting a tradable tape rather than a disorderly crash environment.
ETH is trading close to the daily pivot at $2,062. The first resistance at $2,083 aligns closely with the 20-day EMA at $2,082, creating a congested decision zone just above spot. On the downside, initial support is around $2,049. The article frames the market as undecided while ETH remains roughly in the $2.05k–$2.10k area; a break above $2.10k–$2.15k would challenge the bearish daily bias, while losing $2.05k could increase the odds of a drift toward the lower Bollinger region near $1.93k over time.
While the daily chart leans bearish, lower timeframes show a bullish undercurrent as traders buy dips around $2.05k–$2.07k.
On the 1-hour chart, ETH is described as glued to short-term moving averages, with the regime marked neutral. RSI around 53 suggests a modest intraday bid rather than aggressive selling. Although MACD and signal remain below zero, the MACD line is above the signal and the histogram is positive, which the article reads as an early footprint of a short-term momentum shift higher within the broader downtrend.
Bollinger Bands show price near the upper band around $2,072, while ATR near $12 implies hourly moves of roughly 0.5% on average—enough for active trading but not indicating an imminent volatility shock.
On the execution timeframe, ETH is being bid intraday. Price is above the 20- and 50-EMAs, with the 200-EMA just overhead at $2,071. RSI near 63 indicates bullish momentum without being in classic overbought territory. MACD is positive and above its signal, with a positive histogram, supporting the case for controlled upside pressure.
The Bollinger Bands are tight and price is pushing toward the upper band at $2,071.35. With ATR around $5.7, the article describes a steady upward grind rather than a violent reversal. However, it also notes limited room before intraday buyers meet resistance near the 200-EMA area.
The broader crypto market cap is about $2.39T, up just under 1% over the last 24 hours, while BTC dominance is above 56%. The article characterizes this as a defensive allocation profile, with capital favoring Bitcoin and stablecoins rather than aggressively rotating into altcoins.
The fear & greed index at 9 (Extreme Fear) is highlighted as crucial for the ETH setup. The combination of washed-out sentiment and lack of fresh breakdowns is described as often preceding relief rallies, though the daily trend structure still needs to flip for a more durable change.
The bullish case is framed as a “fear is maxed” squeeze with weak but stable structure. The article points to 1H and 15m momentum already turning up: RSI above 50 on both, positive MACD crosses, and price holding or riding above short EMAs.
Key bullish acceptance zone: $2,080–$2,100, described as the daily resistance pocket and near the 20-day EMA. A sustained push and hold above the 50-day EMA near $2,150 is presented as the real inflection point, which would likely shift the short- and medium-term trend toward neutral–constructive and open the door toward the upper Bollinger band near $2,300.
Bullish confirmation signals:
Bullish invalidation signals:
The bearish case remains anchored to the daily trend favoring sellers, particularly in a Bitcoin-led, risk-off environment. If ETH fails to clear the $2,080–$2,100 resistance pocket and intraday momentum stalls, the squeeze could unwind.
Key bearish trigger: a break back below $2,050, especially if hourly RSI drops below 50 and MACD crosses bearish again. The next target area is described as the lower Bollinger band near $1,930, with ATR suggesting a multi-day slide rather than a single-candle crash unless new external volatility arrives.
Bearish confirmation signals:
Bearish invalidation signals:
The article summarizes the setup as a macro downtrend with a short-term bounce occurring amid extreme fear. Daily indicators (below key EMAs, negative MACD, RSI under 50) argue for caution, while intraday signals (1H and 15m strength, positive MACD crosses, RSI above 50) argue for patience.
Volatility is described as moderate across timeframes, with daily ATR near $100 and hourly ATR around $12. The key battleground is the $2,050–$2,150 zone: below it, ETH remains in a controlled downtrend; above it, the narrative shifts toward a relief phase. The next break from the current $2.05k–$2.10k coil is expected to set the tone for the next leg in the Ethereum price cycle.


In brief\n\nBitcoin dropped to about $93,000, falling back below the EMA50 and putting its recent golden cross at risk of invalidation. The global crypto market cap stands at $3.15 trillion, down 2.38% in 24 hours. On Myriad Markets, 82% of the money is betting on Bitcoin pumping to $100K before…