•
•
•
•
•
•
•
•
•
•
•
•
•
•
•
•
•
•
•
•
•
•
•
•
•
•
•
•
•
•
•
•
•
Solana is undergoing a prolonged correction from its all-time highs, with traders focusing on whether the token can defend the $80 support level. After multiple tests of this area by buyers, Solana is currently trading near $89.13, with a market capitalization above $51,000M. Despite signs of short-term recovery, the price remains below the 100-day simple moving average at $97, a positioning that indicates bears still control the broader trend.
The technical picture is characterized by lower highs and lower lows, reflecting a bearish structure. Solana is about 67% below its all-time high of $260. While bounces have appeared, the primary trend is described as bearish as long as the $100 zone is not reclaimed.
Between $90 and $100, the market has shown repeated rejections, which has limited the ability for an “organic” upward move. At the same time, trading volume has edged higher during consolidations, suggesting aggressive accumulation at lower levels. However, if selling pressure increases and support fails, the article notes that the price could move toward lower liquidity areas.
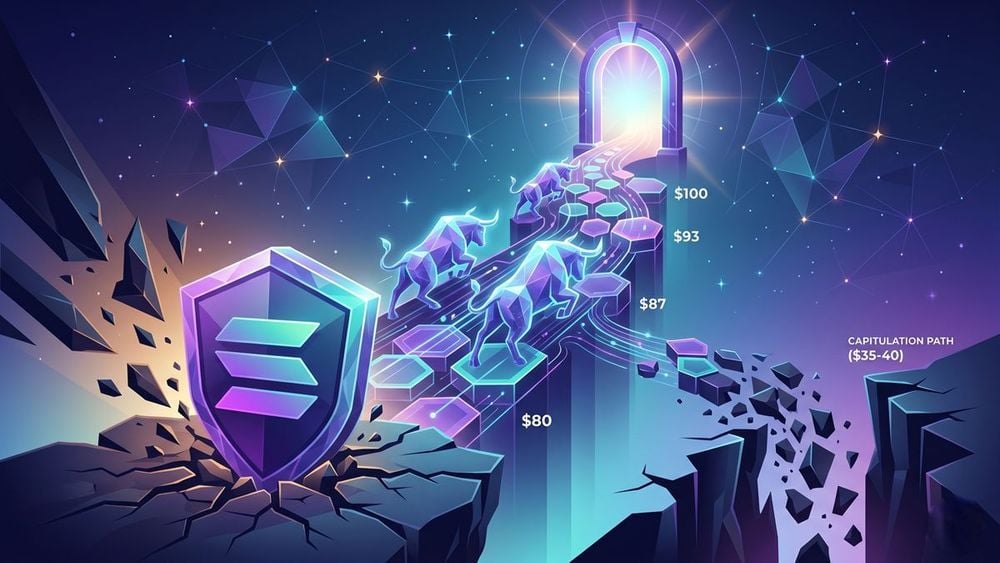
Some analysts cited in the article argue that a break below $78 could open the door to a move toward $50, and potentially to a deeper floor near $35. The defense of $80 is therefore framed as critical to avoiding a larger capitulation event.
Not all signals are presented as negative. The article highlights a potential “composite fulcrum” bottom, a compression pattern that typically precedes a reversal if price can break through the relevant resistance level. Since February 2026, Solana has recorded higher lows, which is described as a gradual strengthening of demand.
To validate the bullish scenario, the article states that Solana would need to close decisively above the $95–$100 range on the daily chart. It also notes that a break of the current resistance at $87 could accelerate gains toward $93 in the short term.
Solana is currently described as trading in a narrow consolidation range, trapped between a demand zone at $82 and supply at $87. This volatility contraction is characterized as a setup that often precedes a larger move in either direction.
The sustainability of any rally is linked to buyers’ ability to absorb sell orders at the 100-day moving average. Until that level is surpassed, any upward movement is framed as temporary relief within a broader bearish structure.
If bullish momentum continues, the next technical target cited is $115, which would represent a major structural shift. The market is therefore waiting for a confirmed breakout above $100 to re-activate bullish sentiment toward that goal.


Premium gym chains are entering a “golden era” that is ending or already in decline, as rising operating costs collide with shifting consumer preferences toward more flexible, community-based ways to exercise. Long-term memberships are shrinking, margins are pressured by higher rents and facility expenses, and competition from smaller, more personalized…