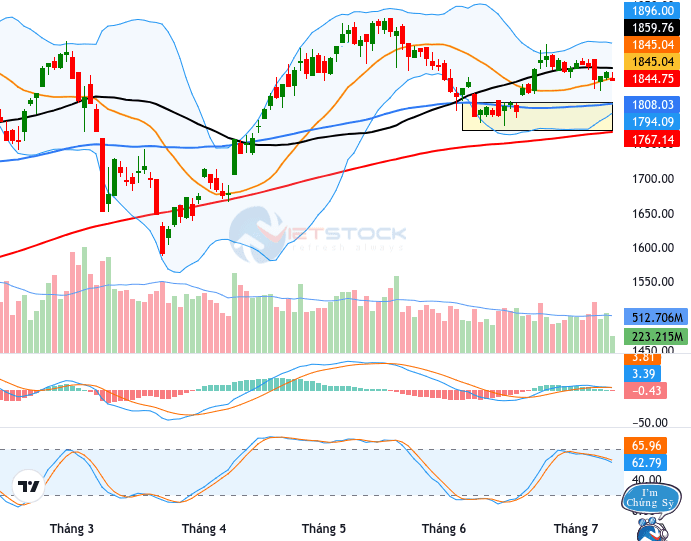
VN-Index continues to trade in a choppy session and shows a candlestick pattern close to a Doji Gravestone, indicating selling pressure remains. The index is currently below the middle line of the Bollinger Bands, with the Stochastic Oscillator continuing to fall after crossing the Signal line. In addition, the MACD is crossing below the Signal line. If this indicator continues to fall and moves below 0 in the coming sessions, the near-term outlook would remain unfavorable.
The current price action suggests ongoing selling pressure, reflected by the candlestick pattern approaching a Doji Gravestone and the position below the Bollinger Bands middle line. The Stochastic Oscillator is declining after crossing the Signal line, and the MACD is moving lower, which could contribute to a softer near-term trajectory if the MACD remains below 0.
Technical signals for the HNX-Index show that in the morning session on 09/07/2026, the HNX-Index rose while a Doji Dragonfly candlestick pattern appeared. However, the index remains below the middle line of the Bollinger Bands, and the MACD distance continues to widen after crossing the Signal line, indicating that the near-term recovery outlook will face further challenges.
The indicators suggest a continued unfavorable near-term bias for the VN-Index, with possible continued weakness unless momentum improves. The HNX-Index likewise faces challenges to establish a near-term recovery given the ongoing gaps between MACD and the Signal line and a price position below the Bollinger middle line.
The provided content does not include explicit expert commentary. The article summarizes technical signals without citing specific analyst opinions.