•
•
•
•
•
•
•
•
•
•
•
•
•
•
•
•
•
•
•
•
•
•
•
•
•
•
•
•
•
•
•
•
•
Week 20–24 April 2026, Vietstock Advisory’s Technical Analysis Department reviewed ten “hot” stocks—DPM, EIB, HDB, MBB, NLG, SHB, STB, TCB, VJC and VNM—based on technical signals, liquidity and investor interest. The following technical notes are intended as short- and long-term reference.
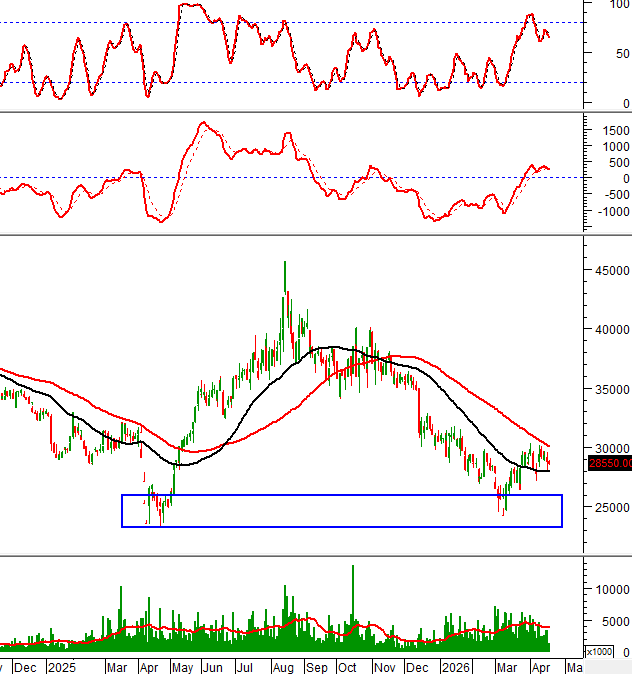
On 17/04/2026, DPM traded in a tight range and formed a Long Upper Shadow candlestick pattern. The price failed to break above the Middle Bollinger Band, suggesting near-term risk. MACD turned downward and fell below 0, indicating caution for investors.

On 17/04/2026, EIB remained range-bound after testing the Middle Bollinger Band. The February 2026 peak (around 23,500–24,500) is acting as a strong short-term resistance. Trading volume fell below the 20-day average, reflecting more cautious investor behavior.
On 17/04/2026, HDB continued to fluctuate and formed a Spinning Top. MACD has been rising after a prior buy signal and is above zero. The December 2025 low (around 23,000–24,500) held during the March 2026 pullback and is expected to provide meaningful support going forward.
On 17/04/2026, MBB traded in a tight range, with a short-term sideways pattern likely to persist. Volume dropped below the 20-day average, signaling cautious trading. The Stochastic Oscillator issued a sell signal. The March 2026 low (around 24,800–25,800) provided support during the latest pullback and is expected to hold.
On 17/04/2026, NLG continued to decline but remained above the 50-day SMA. Volume contracted sharply and stayed below the 20-day average. The Stochastic Oscillator reversed and issued a sell signal, so investors are advised to exercise caution.
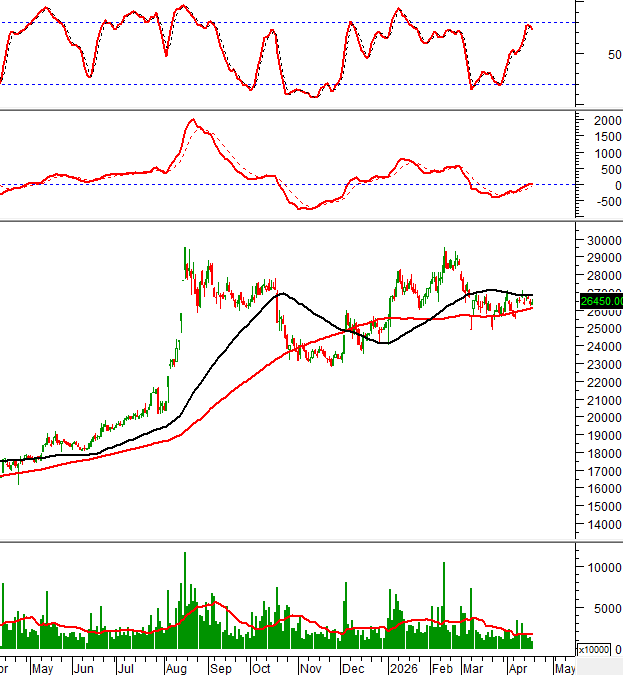
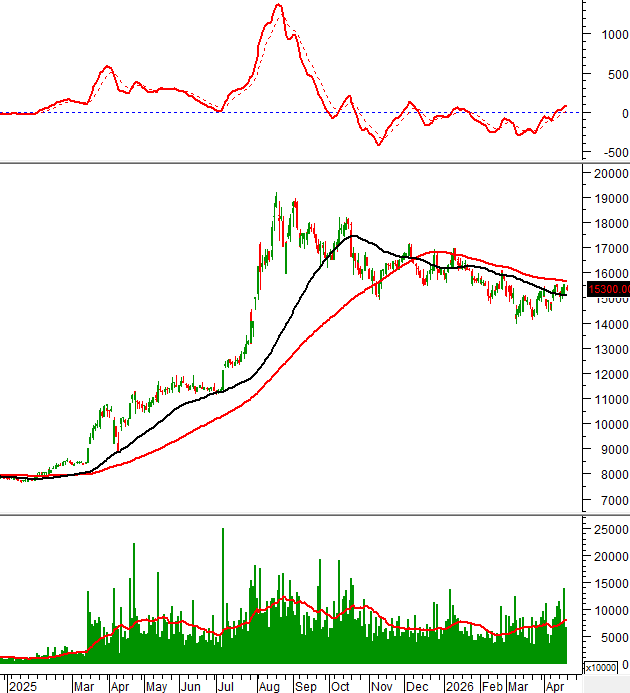
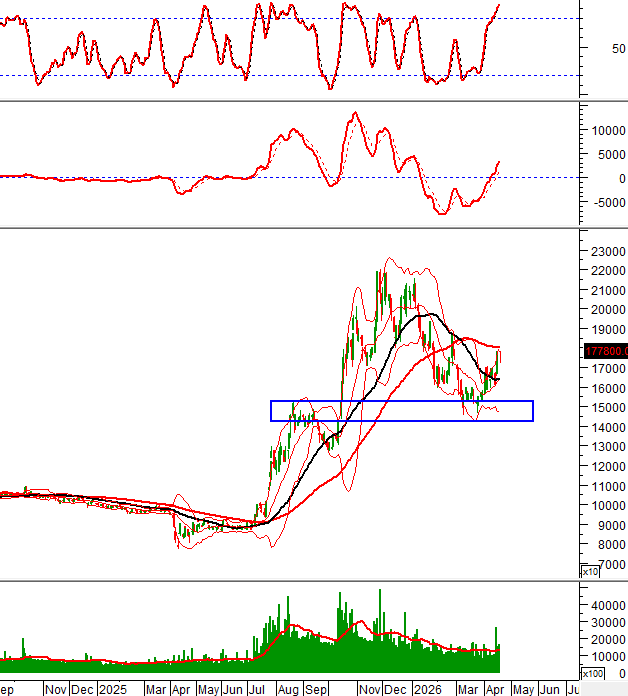
On 17/04/2026, SHB traded in a range and formed a Spinning Top amid continued foreign selling. The price moved above the 50-day SMA, keeping the uptrend outlook intact. The March 2026 low (around 14,000–15,000) is expected to act as strong support if a sudden pullback occurs.
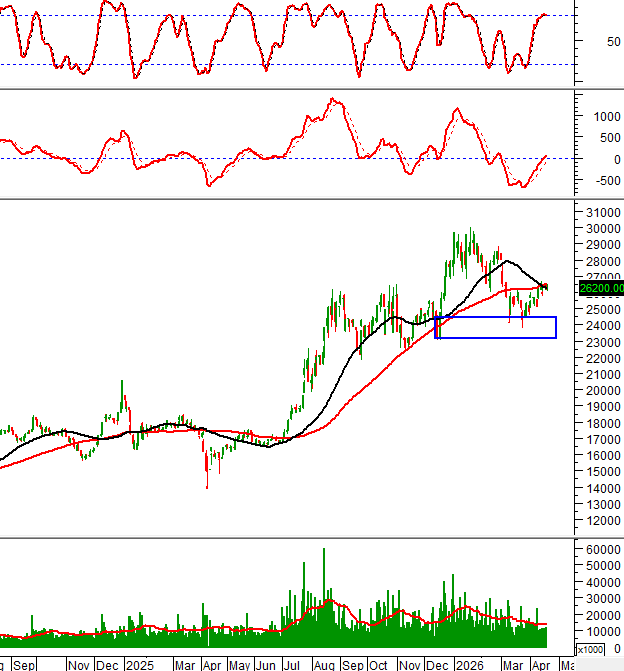
On 17/04/2026, STB remained range-bound and formed a Doji candle. Volume declined below the 20-day average, indicating cautious sentiment. The stock is testing the Middle Bollinger Band and the 50-day SMA; the result is expected to influence the near-term trend.
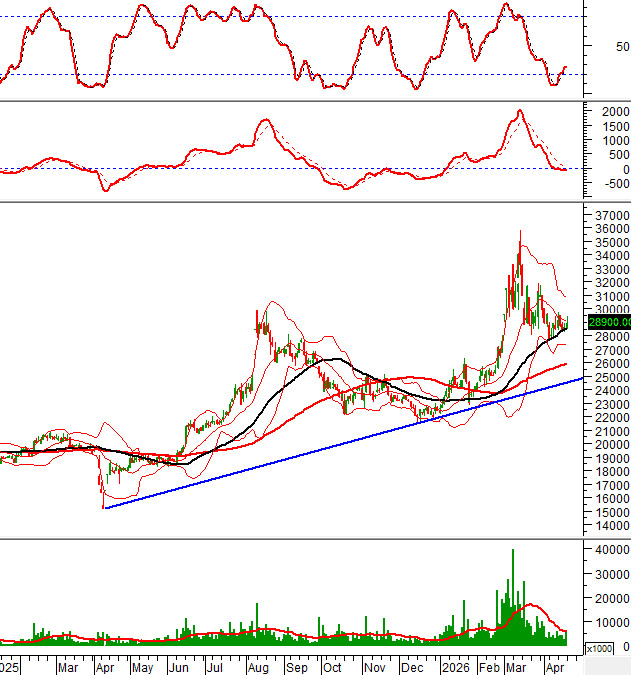
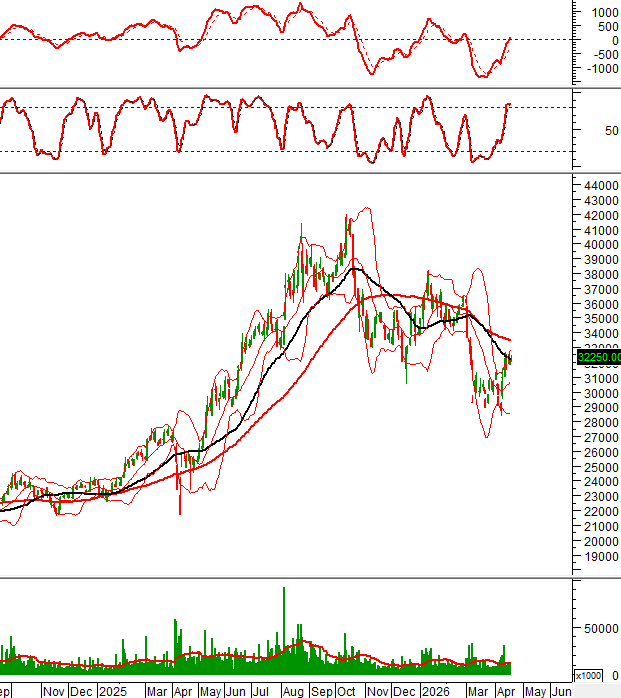
On 17/04/2026, TCB stayed in a range and formed a Spinning Top. Volume rose above the 20-day average, suggesting buyers are not overly cautious. The analysis highlights strong support in the 28,000–32,500 price area.
On 17/04/2026, VJC printed a Long Lower Shadow candlestick. Volume remained consistently above the 20-day average, indicating renewed money flow. The price broke above the Bollinger Bands’ middle band and the 50-day SMA, supporting a buying bias.
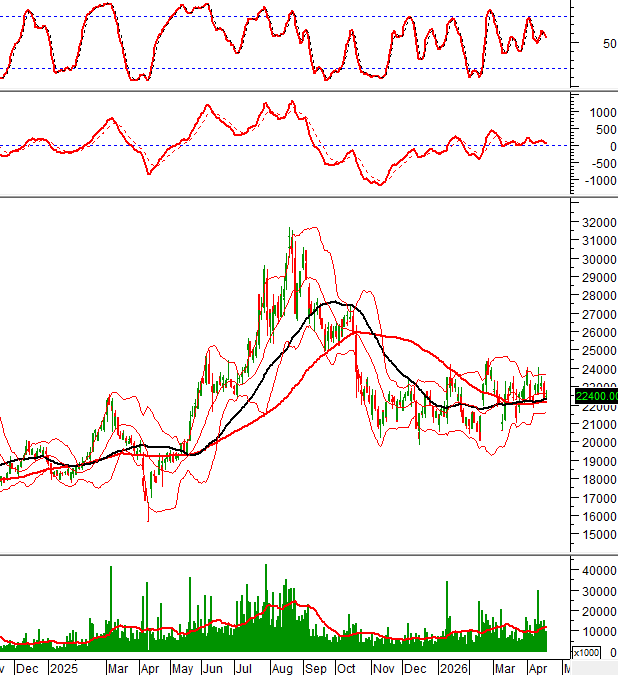
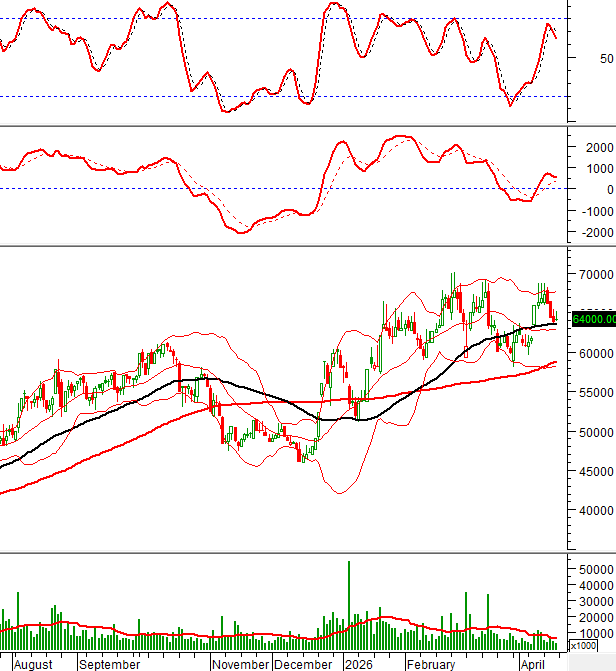
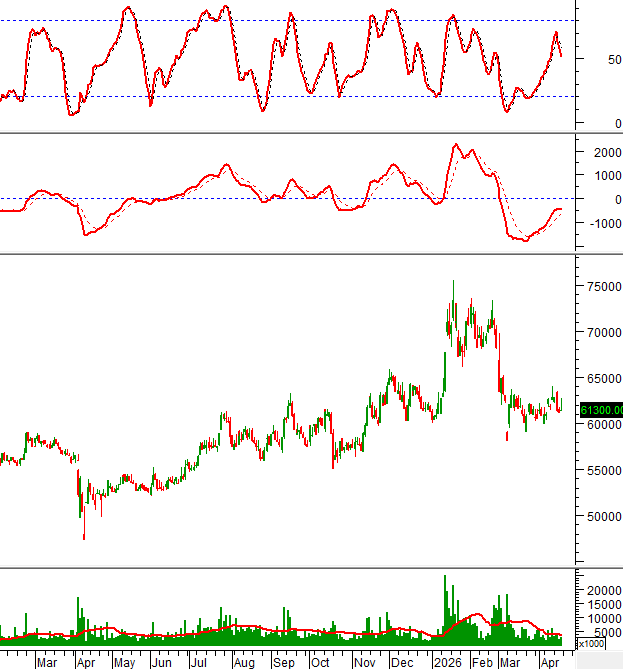
On 17/04/2026, VNM showed strong consolidation and formed a Gravestone Doji, with foreign selling continuing. The Stochastic Oscillator reversed unexpectedly and issued a sell signal, increasing near-term risk. The stock is set to test the March 2026 low again (around 59,000–61,000), and bottom-fishing around this region is favored.
Technical Analysis Team, Vietstock Advisory
FILI — 08:58 20/04/2026


Bitcoin (BTC) investors who use steady dollar-cost averaging (DCA) may be underperforming versus strategies that adjust exposure to the market’s cycle, according to new research arguing that Bitcoin’s behavior differs from traditional long-duration assets.
In a report cited by Markus Thielen of 10x Research, Bitcoin’s market…