•
•
•
•
•
•
•
•
•
•
•
•
•
•
•
•
•
•
•
•
•
•
•
•
•
•
•
•
•
•
•
•
•

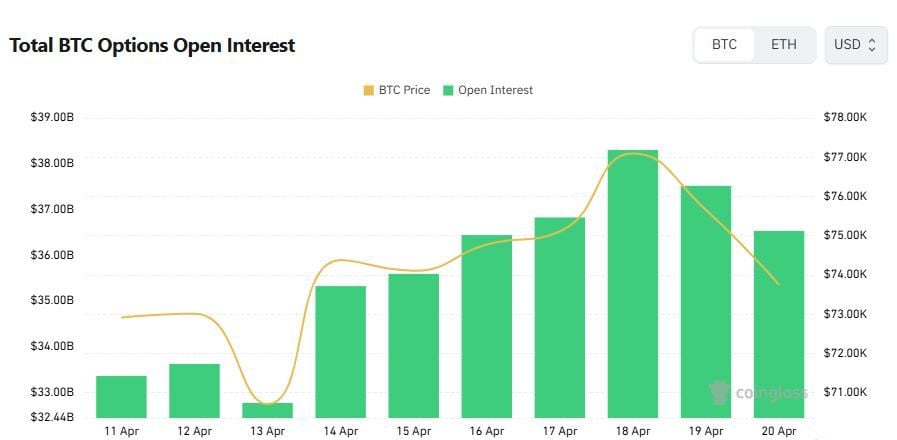
Bitcoin found strong support on Monday and rebounded, keeping alive the possibility of another move higher. Traders are watching key technical levels around $74,000 as the market attempts to shift momentum and potentially target the $80,000 area.
On the 4-hour chart, the BTC price rebounded from the strong $74,000 horizontal support level. It also bounced from a rising trendline that has supported price action since the bottom of a bear-flag formation, suggesting that the uptrend support structure remains intact.
Stochastic RSI is described as rising from the bottom, which the article frames as supportive of a potential push toward the top of the bear flag. The piece also notes a risk: if negative developments emerge from the Middle East conflict, BTC could reverse, with the bear-market trendline potentially acting as support and prompting a retest.
On the daily timeframe, bulls are attempting to reverse the downward trend. The article highlights an “extremely important” break of an almost 7-month bear-market trendline as a key positive development, while acknowledging that the price could return to test and confirm that level.
Two simple moving averages are also cited. The 50-day SMA is angled upward and could cross back above the 100-day SMA in the near term. Meanwhile, the 100-day SMA is described as providing support, which could help sustain the bounce.
In the Relative Strength Index (RSI), the indicator line is said to be moving upward within a rising channel. It was recently rejected from a descending trendline (marked as a bold, blue line), but the article suggests there may be another attempt to break upward through it. That descending trendline is described as beginning in November 2024, and a breakout would be “of huge significance” for bulls.
The weekly timeframe is presented as the clearest bullish signal. The article points to a breakout of the downtrend, but says confirmation is still needed—specifically, that the current weekly candle remains above the trendline.
It also cites Fibonacci levels. The deepest retracement level mentioned is 0.786, and the article states that weekly candles have stayed above this level, even if some candle wicks dipped below. It further notes that the market’s rally to a $126,000 all-time high—after rising from the bottom of an 8-month bull flag in 2024—has retraced to that Fibonacci 0.786 level.
Finally, the RSI is described as showing a strong breakout of a descending trendline. If confirmed by the end of the week, the article suggests it could mark the start of another major upside rally.
The article acknowledges that BTC could also enter an extended period of sideways price action rather than a sharp upside surge. However, it concludes that if bulls deliver a “decent outcome” by the end of the week, the trend back to the upside could begin to take shape.


Premium gym chains are entering a “golden era” that is ending or already in decline, as rising operating costs collide with shifting consumer preferences toward more flexible, community-based ways to exercise. Long-term memberships are shrinking, margins are pressured by higher rents and facility expenses, and competition from smaller, more personalized…


