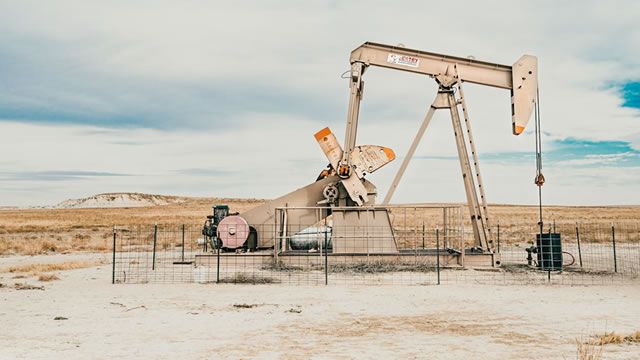
Crude oil rebounded from a key support zone, forming a higher low that keeps the bullish recovery intact and sets up another test of resistance near the 200-day average. Support Zone Holds as Bullish Reversal Forms Crude oil has set the stage for another leg up following a bounce from support near key indicators. A support zone is identified by the confluence the 50-day and 20-day moving averages, the neckline of a double bottom, and a downtrend line. A one-day bullish reversal triggered on Tuesday and established a minor higher swing low at a likely significance price zone. This behavior suggests that the first pullback following recent breakouts could have at least one more leg up to go. Or a more significant bullish reversal could still be getting started. Higher Swing Low Points to Another Upside Test A higher daily high of $60.63 was reached on Tuesday. That was a three-day high and it followed a higher low of $58.84 earlier in the session. Last week’s swing high hit resistance at 62.39, just a little shy of the 200-day moving average, currently at $62.62. That was the first approach to the 200-day line as resistance since late September. Although the 200-day average does indicate a potentially significance resistance zone, recent signs of strength suggest it could be vulnerable to an upside breakout. If this week’s higher swing remains, it suggests that another test of resistance near the 200-day line could follow. And that allows for the possibility of a reclaim of the line as well. Resistance Cluster Near 200-Day Average Potential resistance near the 200-day line is strengthened by a couple other indicators. There is a 50% retracement level at $63.16. That is a common minimum retracement for swings and therefore a solid potential target. In addition, the double bottom measures to $63.00. A decisive breakout above $63.16 would suggest that the 61.8% Fibonacci retracement at $65.09 may be reached. Monday’s low of $58.67 is key short-term support as a failure would negate the bullish implications of the higher swing low. Weekly Structure Suggests Range-Bound Conditions There was a sharp fall following last week’s $62.39 high resulting in a bearish inverted hammer weekly candle. A breakdown through the bottom of the week at $58.50 is needed before the pattern is valid. Nonetheless, it established a relatively wide range where crude oil may continue to trade before offering further clarity as to direction beyond the range. If you’d like to know more about what drives oil prices, please visit our educational area.


](https://cms-beta.indexcdn.com/cold_weather_causes_these_stocks_to_rally_reported_merger_20260120_39c5999bdc.jpg)