Get the latest crypto news, updates, and reports by subscribing to our free newsletter.
Giấy phép số 4978/GP-TTĐT do Sở Thông tin và Truyền thông Hà Nội cấp ngày 14 tháng 10 năm 2019 / Giấy phép SĐ, BS GP ICP số 2107/GP-TTĐT do Sở TTTT Hà Nội cấp ngày 13/7/2022.
© 2026 Index.vn
Foreign direct investment (FDI) into Ho Chi Minh City rose 220% year-on-year in the first quarter of 2026, according to the Ho Chi Minh City Statistics Department. The city recorded 10 notable registered capital projects for the quarter, with many involving Singaporean investors. The figures suggest foreign investor confidence in…

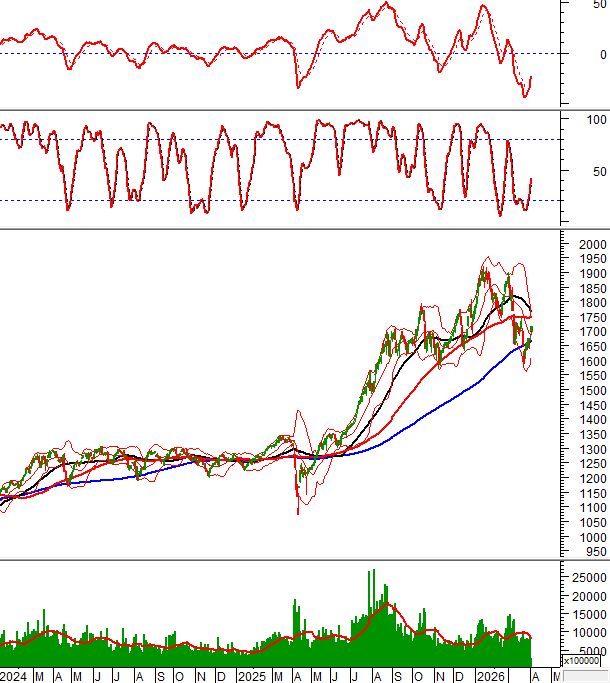
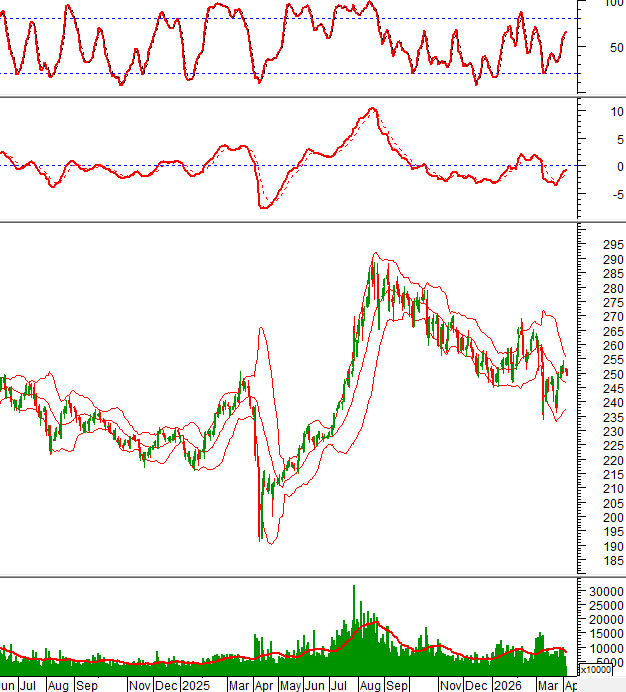
The VN-Index traded in a tight range during the afternoon session on April 3, 2026 and formed a Long Upper Shadow candlestick pattern, a sign of substantial selling pressure. The HNX-Index corrected but remained above the Middle line of the Bollinger Bands.
In the morning session on April 3, 2026, the VN-Index also moved within a tight range and formed a Long Upper Shadow candlestick pattern, indicating selling pressure. Despite this, the Stochastic Oscillator and MACD continued to move higher after previously signaling a strong buy.
In the morning session on April 3, 2026, the HNX-Index corrected but stayed above the Middle line of the Bollinger Bands. Trading volume fell to relatively low levels, suggesting limited near-term volatility.
In the morning session on April 3, 2026, CTD’s stock price fell for the third consecutive day, with reduced morning volume, reflecting cautious investor sentiment. The price was testing the Middle line of the Bollinger Bands, while MACD indicated a selling signal. However, a golden cross between the 50-day SMA and the 100-day SMA has formed. If technical signals improve, the near-term risk may be lower.
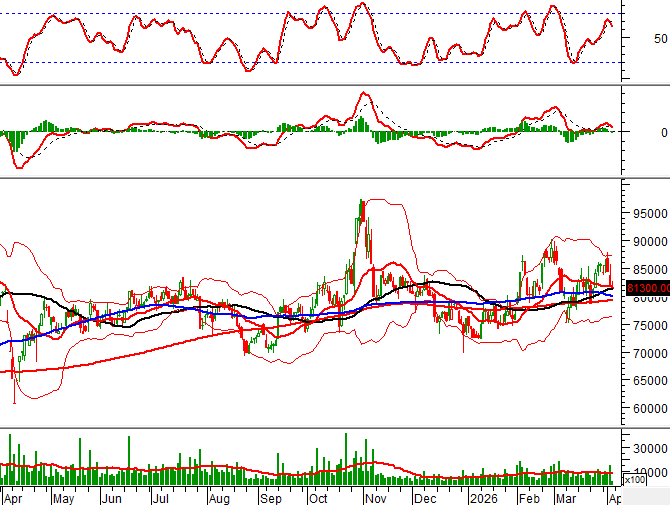
VCG’s stock price continued to decline in the morning session on April 3, 2026, with volume consistently below average, indicating bearish investor sentiment. The Bollinger Bands continued to narrow, while ADX declined and was in the gray zone (20


In brief\n\nBitcoin dropped to about $93,000, falling back below the EMA50 and putting its recent golden cross at risk of invalidation. The global crypto market cap stands at $3.15 trillion, down 2.38% in 24 hours. On Myriad Markets, 82% of the money is betting on Bitcoin pumping to $100K before…