•
•
•
•
•
•
•
•
•
•
•
•
•
•
•
•
•
•
•
•
•
•
•
•
•
•
•
•
•
•
•
•
•
Vietnam’s imports of agricultural, forestry and fishery products in Q1 2026 reached nearly USD 12 billion, according to the Ministry of Agriculture and Rural Development.
In March 2026, Vietnam’s import value for the sector was estimated at USD 4.46 billion, up 37% from the previous month and up 6.6% year on year. In the first three months of 2026, total imports reached USD 11.91 billion, up 3.6% compared with the same period last year.
By product group, Vietnam imported:
Among individual items, salt imports reached USD 9.1 million in Q1 2026, up 75.6% year on year.
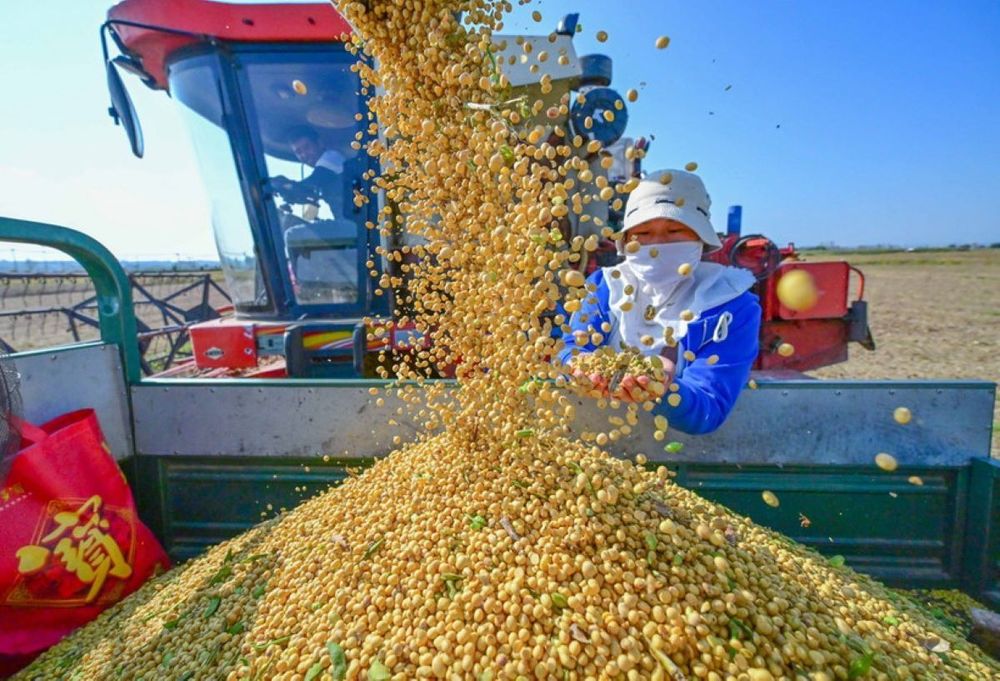
Imports of grains and related commodities rose strongly in the first quarter. Vietnam imported 847 thousand tons of soybeans in Q1 2026, worth USD 405 million.
Key commodity movements included:
For fruits and vegetables, March 2026 imports reached USD 230 million, bringing the first-quarter total to USD 795.4 million, up 31.5% year on year. China and the United States were the largest supplying markets, with shares of 37.9% and 29.5%, respectively. Imports from China rose 41.2% and imports from the United States rose 52.2% year on year.
Asia and the Americas remained the main sources of Vietnam’s agricultural, forestry and fishery imports, with market shares of 27.7% and 26.6%, respectively. Other regions accounted for smaller shares: Oceania 4.6%, Europe 3.9% and Africa 3.8%.
Compared with the same period in 2025, imports from Asia fell 2.7%, while imports from the Americas rose 10.9%. Oceania increased 38.2% and Africa rose 56%, while Europe declined 3.3%.
By country, the United States, China and Brazil were the three largest supplying markets, with shares of 11.8%, 9.9% and 9.8%, respectively. Imports from the United States rose 53.4% year on year, imports from China rose 13.3%, and imports from Brazil rose 11.1%.
In the cashew sector, March 2026 imports totaled 350 thousand tons valued at USD 577.4 million. In the first three months of 2026, imports reached 636 thousand tons and USD 1.04 billion, up 12.5% in volume and 13.1% in value. Tanzania was the largest supplier (33.1%), followed by Cambodia (21.2%), Ivory Coast (19.8%) and Indonesia (2.2%).
Imports of rubber in Q1 2026 were 441.4 thousand tons, worth USD 707.4 million, up 3.2% in volume but down 4.7% in value. The main supplying markets were Cambodia (31.4%), China (16.2%) and South Korea (10.7%).
For seafood, March 2026 imports were estimated at USD 280 million, bringing the first-quarter total to USD 746.8 million, down 1.8% year on year. Major supplying markets included India (16%), Indonesia (12.4%) and Norway (11.8%).
Meanwhile, imports of wood and wood products in March 2026 reached USD 270 million, lifting the first-quarter total to USD 775.4 million, up 16.1% year on year. China, the United States and France were the top sources, with shares of 38.4%, 21% and 3.7%. Compared with 2025, imports from China rose 12%, imports from the United States rose 2.1 times, and imports from France rose 27.7%.
Despite growth in some commodity groups, several agricultural input categories showed a downward trend in the first three months of 2026.
Fertilizer imports in March 2026 were estimated at 450 thousand tons, worth USD 134.9 million. In the first three months of 2026, total fertilizer imports reached 910.2 thousand tons with a value of USD 290.9 million, down 31.7% in volume and 30.9% in value versus the same period in 2025. The average import price rose slightly to USD 319.6 per ton.
The trade balance of agricultural, forestry and fishery products in March 2026 was estimated at a surplus of USD 1.55 billion, up 90.9% from the previous month but down 19.3% year on year. In the first three months of 2026, the agro-forestry-fishery trade surplus was estimated at USD 4.78 billion, up 12% year on year.
China remained the largest fertilizer supplier with a 48.2% share, followed by Russia (16.2%) and Laos (7.6%). Compared with the same period, import value from China declined by 12.1%, from Russia declined by 56.5%, and from Laos fell by 14.2%. Among the 15 largest markets, Thailand recorded the strongest growth at 32.1%, while Israel decreased by 88.9%.
For animal feed and raw materials, the value of imports in March 2026 was estimated at USD 420 million, bringing the three-month total to USD 1.05 billion, down 9.5% year on year. The United States, Argentina and China were the top supplying markets, accounting for shares of 26.5%, 21.7% and 9.8%, respectively. Imports from the United States rose 48.8% and imports from China rose 33.3%, while imports from Argentina dropped 62%. Among the 15 largest markets, Canada showed the strongest growth at 2.6 times, while Brazil declined the most at 66.8%.
Pesticides and agrochemical inputs: March 2026 imports were estimated at USD 120 million, bringing the first three months to USD 243.9 million, up 1% year on year. China remained the main supplier (44.5%), followed by India (15%) and Singapore (5.6%). However, values from these main markets declined in the first two months of 2026, with China down 10.1% and India down 12.3%, indicating a rebalancing in the import structure for this item.

Premium gym chains are entering a “golden era” that is ending or already in decline, as rising operating costs collide with shifting consumer preferences toward more flexible, community-based ways to exercise. Long-term memberships are shrinking, margins are pressured by higher rents and facility expenses, and competition from smaller, more personalized…